Monitoring & Dashboard
The Portex Dashboard provides real-time insights into your active tunnels and incoming traffic. It's the mission control for your development environment.
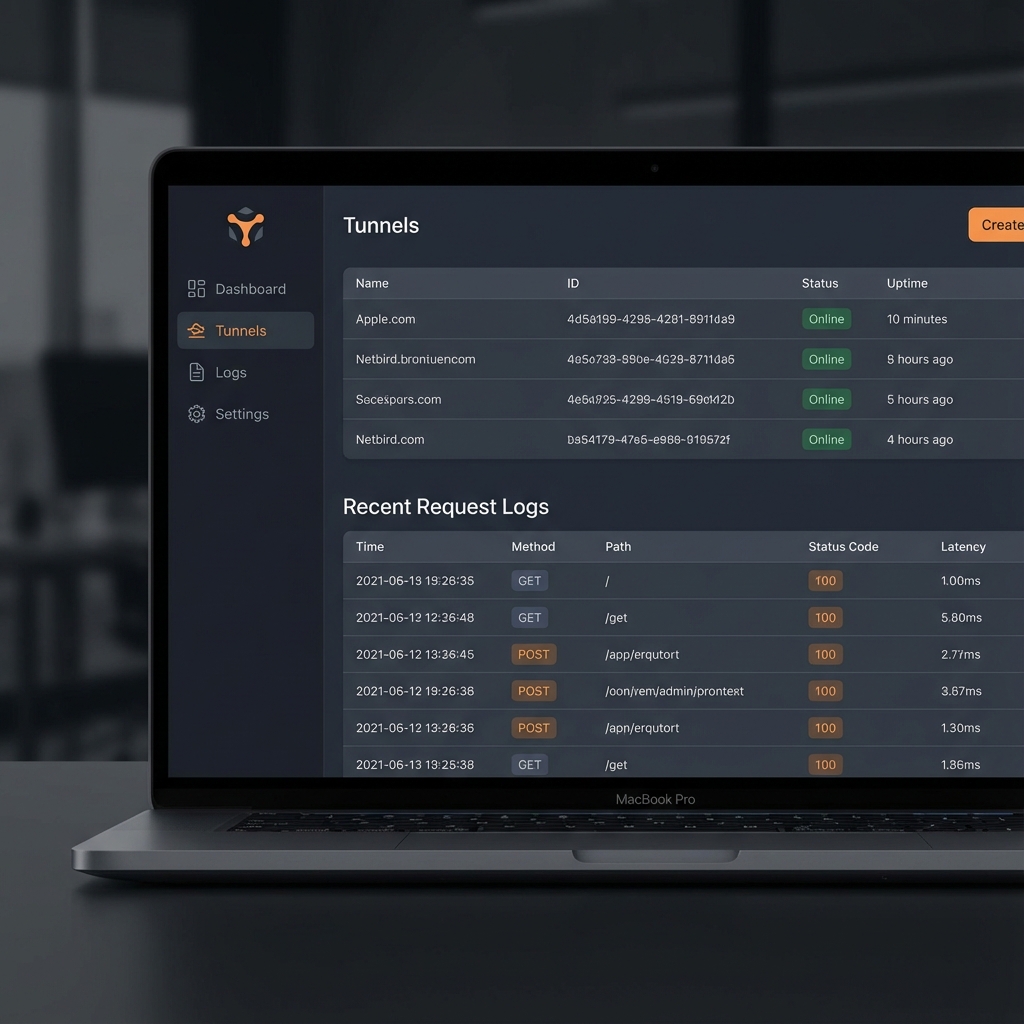
Tunnel Management
In the "Tunnels" section, you can see all agents currently connected to your account. You can view their public URLs, local ports, and current status (Online/Offline).
Real-time Activity Log
One of the most powerful features of Portex is the Activity Log. For every request that hits your tunnel, we capture:
- Method & Path: e.g.,
POST /api/webhooks - Status Code: See if your local server responded with an error instantly.
- Response Time: Monitor the latency of your local service.
- Full Payload: Inspect headers and body content to debug integration issues.
Replay Requests
Debugged your code but missed the original webhook? No problem. Use the Replay button in the dashboard to resend the exact same request to your local environment without having to trigger the external service again.
Analytics
Premium users get access to bandwidth usage stats and extended log retention.